
Establishment of the prediction model based on PI-RADS v2 score for prostate cancer in patients with PSA range from 4 to 10 ng/mL
-
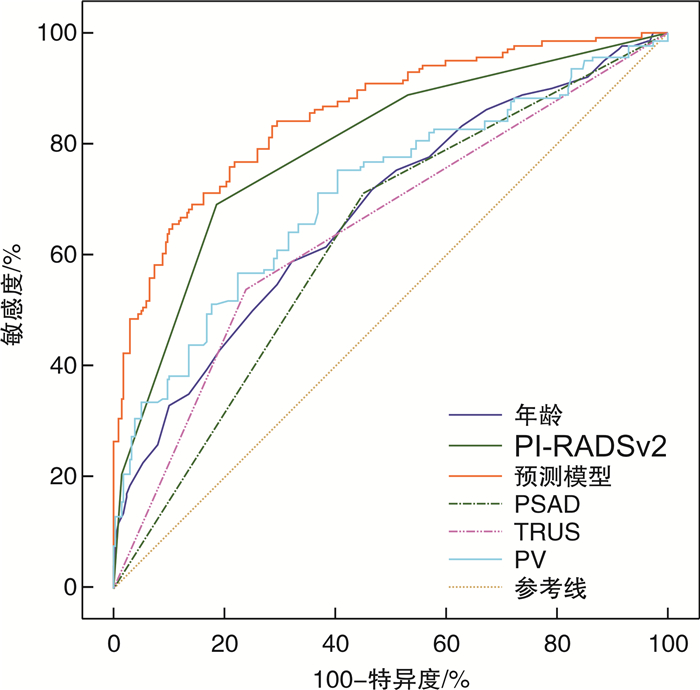
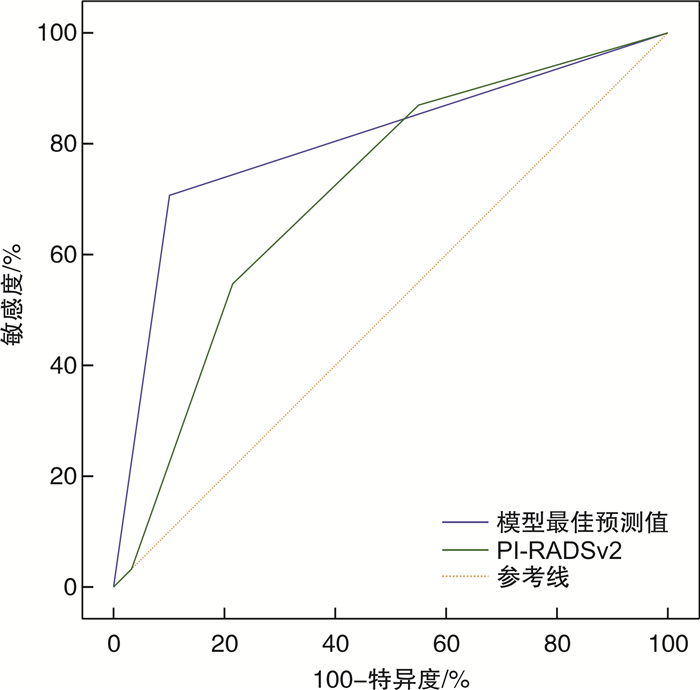
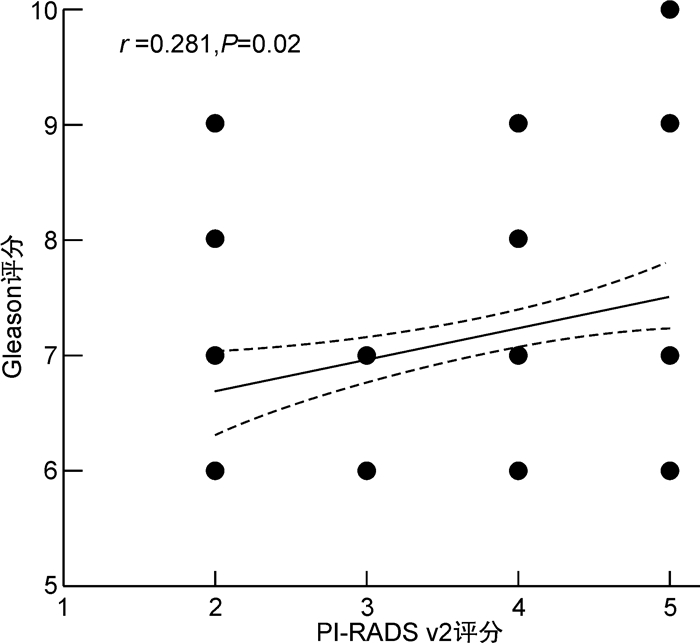
摘要: 目的 联合核磁共振第2版前列腺影像报告和数据系统(prostate imaging reporting and data system version 2,PI-RADS v2)与其他临床指标,建立前列腺特异性抗原(PSA)“灰区”(4~10 ng/mL)患者的前列腺癌(prostate cancer,PCa)预测模型,并验证模型的准确性。方法 回顾性分析2016年1月—2020年12月在我院行前列腺穿刺活检的PSA“灰区”患者的临床资料,包括年龄、血清PSA、游离/总PSA比值(f/tPSA)、前列腺体积(prostate volume,PV)、PSA密度(PAS density,PASD)、经直肠前列腺超声(transrectal ultrasonography,TRUS)结果、PI-RADS v2评分等临床指标。其中2016年1月—2019年12月纳入病例作为模型构建组,2020年1月—2020年12月为模型验证组。采用二元logistic单因素及多因素分析计算PCa的独立预测因素,依据回归系数建立预测模型,通过ROC曲线下面积(area under curve,AUC)对比预测模型与临床指标对PSA“灰区”患者的PCa预测价值,并在模型验证组检验模型最佳预测值的准确性。结果 模型构建组共纳入患者349例,年龄(69.4±8.0)岁,PSA(7.9±1.9) ng/mL,f/tPSA(0.15±0.70),PSAD(0.18±0.10),PV(53.5±28.5) mL,TRUS异常90例(25.8%),PI-RADS v2(3.79±0.90)分。病理诊断PCa 122例(35.0%)。在恶性肿瘤组中,Spearman相关性分析结果显示Gleason评分与PI-RADS v2评分呈正相关,多因素分析显示年龄(OR=1.083,P=0.001)、TRUS(OR=1.832,P=0.040)、PV(OR=0.975,P=0.003)、PI-RADS v2评分(OR=3.160,P<0.001)是PCa的独立预测因素,建立预测模型为-8.665+0.080×年龄+0.157×PASD-0.025×PV+0.605×TRUS+ 1.151×PI-RADS v2,ROC-AUC比较示预测模型(0.855)>PI-RADS v2(0.794)>年龄(0.680)>TURS(0.650)>PSAD(0.630),差异有统计学意义(P<0.05),ROC曲线提示模型最佳预测界值为-0.659 5时敏感度为83.6%,特异度为71.4%。在模型验证组,患者共118例,病理诊断PCa 34例(28.8%),将临床指标带入预测模型计算预测值,ROC曲线示模型最佳预测界值>-0.659 5的诊断效能高于PI-RADS v2评分(AUC 0.803 vs. 0.710,P=0.040)。结论 基于PI-RADS v2评分建立的预测模型对PSA“灰区”患者的PCa有较高的预测价值,优于单独应用PI-RADS v2评分,能够更好地指导PSA“灰区”患者的前列腺穿刺活检和随访。Abstract: Objective To establish a more efficient prediction model for prostate specific antigen (PSA) "grey area" (4-10 ng/mL) patients with prostate cancer (PCa) through combining prostate imaging reporting and data system version 2 (PI-RADS v2) and other clinical data, and test the accuracy of the model.Methods A retrospective study was performed from Jan. 2016 to Dec. 2020, and patients'clinical data including age, PSA, f/tPSA, prostate volume (PV), PSA density (PSAD), transrectal ultrasonography (TRUS) result and PI-RADS v2 score were collected through reviewing medical record system. Cases from Jan. 2016 to Dec. 2019 were used for model establishment and cases from Jan. 2020 to Dec. 2020 for model verification. The correlation between each factor and PCa was analyzed by binary univariate and multivariate logistic regression. The prediction models were established according to the regression coefficient. The area under the curve (AUC) was used to compare the prediction value of each factor and the prediction model. Meanwhile, in the verification group, the accuracy of the model's best predictions was verified.Results In total 349 were enrolled in this study, age (69.4±8.0) years old, PSA (7.9± 1.9)ng /mL, f/tPSA (0.15±0.70), PSAD(0.18±0.10), PV (53.5± 28.5)mL, PI-RADS v2 score (3.79±0.90), 90 patients (25.8%) with TRUS positive results. Biopsy revealed 122 cases (35.0%) with carcinoma. In the malignant tumor group, the results of correlation analysis between Gleason score and PI-RADS v2 score showed that Gleason score was positively correlated with PI-RADS score. Multivariate analysis showed that age (OR=1.083,P=0.001), TRUS positive (OR=1.832,P=0.040), PV (OR=0.975,P=0.003) and PI-RADS v2 score (OR=3.160,P< 0.001) were independent risk factors for PCa. The prediction model was -8.665+0.080×Age+0.157×PASD-0.025×PV+0.605×TRUS+ 1.151×PI-RADS v2. The comparation of ROC-AUC indicated prediction model (0.855) > PI-RADS v2 (0.794) > age (0.680) > TURS (0.650) > PSAD (0.630), which were significant difference (P< 0.05). When best prediction critical value was -0.659 5, it has a sensitivity of 83.6% and a specificity of 71.4%. In the verification group, 118 cases were enrolled and 34 cases were diagnosed as having PCa (28.8%). Bring clinical indicators into the predictive model to calculate the predictive values, and ROC indicated that diagnostic effectiveness of predictive value was superior to PI-RADS v2 when predictive value was greater than -0.659 5 (AUC 0.803 vs. 0.710,P=0.040).Conclusion The prediction model based on PI-RADS v2 has higher predictive value for PSA "grey area" patient, and is better than the individual application of PI-RADS v2, which can better guide prostate biopsy and follow-up in the PSA "grey area" patient.
-
Key words:
- prostate cancer /
- magnetic resonance imaging /
- prostate specific antigen /
- prediction
-

-
表 1 模型构建组患者基本临床资料特征
X±S 项目 良性 恶性 t/χ2 P值 例数 227 122 年龄/岁 67.3±7.2 72.5±8.1 -4.343 0.002 PSA/(ng·mL-1) 7.79±1.88 8.04±1.89 -1.234 0.906 f/tPSA 0.16±0.08 0.15±0.66 1.296 0.407 PSAD 0.15±0.63 0.22±0.12 -7.556 <0.001 TRUS异常/例(%) 49(24.1) 41(33.6) 5.974 0.015 PV/mL 59.79±24.78 44.73±24.68 5.610 <0.001 PI-RADS v2评分/分 2.73±0.80 3.79±0.90 -11.578 <0.001  下载: 导出CSV
表 2 预测因素二元logistics回归分析结果
项目 单因素分析 多因素分析 OR 95%CI OR 95%CI 年龄 1.095 1.061~1.129 <0.001 1.083 1.042~1.126 0.001 PSA 1.074 0.959~1.204 0.217 f/tPSA 0.132 0.006~2.911 0.199 PSAD 2.988 1.900~4.697 <0.001 1.171 0.560~2.446 0.675 PV 0.972 0.961~0.983 <0.001 0.975 0.960~0.991 0.003 TRUS异常 3.706 2.345~5.856 <0.001 1.832 1.027~3.268 0.040 PI-RADS v2评分 3.797 2.819~5.114 <0.001 3.160 2.294~4.354 <0.001
下载: 导出CSV
表 3 模型验证组与模型构建组一般资料比较
项目 模型验证组 模型构建组 t/χ2 P值 例数 118 349 年龄/岁 70.7±7.2 69.4±8.0 1.558 0.120 PSA/(ng·mL-1) 8.06±1.80 7.90±1.89 0.816 0.415 f/tPSA 0.17±0.12 0.15±0.70 1.713 0.097 PSAD 0.17±0.08 0.18±0.10 -1.484 0.139 TRUS异常/例(%) 38(32.2) 90(25.8) 1.820 0.177 PV/mL 42.08±17.7 53.5±28.5 1.610 0.165 PI-RADS v2评分/分 3.53±0.71 3.79±0.90 -11.578 0.727 PCa/例(%) 34(28.8) 122(35.0) 1.496 0.221
下载: 导出CSV
-
[1] Siegel RL, Miller KD, Jemal A. Cancer statistics, 2020[J]. CA Cancer J Clin, 2020, 70(1): 7-30. doi: 10.3322/caac.21590
[2] 罗进阳, 庄炫, 郑嘉欣, 等. 基于第二版PI-RADS建立的预测模型对前列腺穿刺活检结果的预测价值[J]. 中华泌尿外科杂志, 2019, 40(9): 673-679. doi: 10.3760/cma.j.issn.1000-6702.2019.09.007
[3] Fang D, Ren D, Zhao C, et al. Prevalence and Risk Factors of Prostate Cancer in Chinese Men with PSA 4-10 ng/mL Who Underwent TRUS-Guided Prostate Biopsy: The Utilization of PAMD Score[J]. Biomed Res Int, 2015, 2015: 596797.
[4] Wei CG, Chen T, Zhang YY, et al. Biparametric prostate MRI and clinical indicators predict clinically significant prostate cancer in men with "gray zone" PSA levels[J]. Eur J Radiol, 2020, 127: 108977. doi: 10.1016/j.ejrad.2020.108977
[5] Weinreb JC, Barentsz JO, Choyke PL, et al. PI-RADS Prostate Imaging-Reporting and Data System: 2015, Version 2[J]. Eur Urol, 2016, 69(1): 16-40. doi: 10.1016/j.eururo.2015.08.052
[6] 张强, 蔡宇坤, 张晓卿, 等. 多参数磁共振PI-RADS评分系统在疑似前列腺癌患者中的诊断价值[J]. 临床泌尿外科杂志, 2020, 35(3): 171-175. http://lcmw.cbpt.cnki.net/WKC/WebPublication/paperDigest.aspx?paperID=05cb7d00-1159-4aee-8342-ba2aec3a5718
[7] Panebianco V, Giganti F, Kitzing YX, et al. An update of pitfalls in prostate mpMRI: a practical approach through the lens of PI-RADS v. 2 guidelines[J]. Insights Imaging, 2018, 9(1): 87-101. doi: 10.1007/s13244-017-0578-x
[8] 中华医学会泌尿外科学分会, 中国前列腺癌联盟. 前列腺穿刺中国专家共识[J]. 中华泌尿外科杂志, 2016, 37(4): 241-244. doi: 10.3760/cma.j.issn.1000-6702.2016.04.001
[9] Dwivedi DK, Kumar R, Dwivedi AK, et al. Prebiopsy multiparametric MRI-based risk score for predicting prostate cancer in biopsy-naive men with prostate-specific antigen between 4-10 ng/mL[J]. J Magn Reson Imaging, 2018, 47(5), 1227-1236. doi: 10.1002/jmri.25850
[10] Aminsharifi A, Howard L, Wu Y, et al., Prostate Specific Antigen Density as a Predictor of Clinically Significant Prostate Cancer When the Prostate Specific Antigen is in the Diagnostic Gray Zone: Defining the Optimum Cutoff Point Stratified by Race and Body Mass Index[J]. J Urol, 2018, 200(4), 758-766. doi: 10.1016/j.juro.2018.05.016
[11] Xu N, Wu YP, Chen DN, et al. Can Prostate Imaging Reporting and Data System Version 2 reduce unnecessary prostate biopsies in men with PSA levels of 4-10 ng/ml?[J]. J Cancer Res Clin Oncol, 2018, 144(5): 987-995. doi: 10.1007/s00432-018-2616-6
[12] Distler FA, Radtke JP, Bonekamp D, et al. The Value of PSA Density in Combination with PI-RADSTM for the Accuracy of Prostate Cancer Prediction[J]. J Urol, 2017, 198(3): 575-582. doi: 10.1016/j.juro.2017.03.130
[13] Washino S, Okochi T, Saito K, et al. Combination of prostate imaging reporting and data system(PI-RADS)score and prostate-specific antigen(PSA)density predicts biopsy outcome in prostate biopsy naïve patients[J]. BJU Int, 2017, 119(2): 225-233. doi: 10.1111/bju.13465
[14] Qi Y, Zhang S, Wei J, et al. Multiparametric MRI-Based Radiomics for Prostate Cancer Screening With PSA in 4-10 ng/mL to Reduce Unnecessary Biopsies[J]. J Magn Reson Imaging, 2020, 51(6), 1890-1899. doi: 10.1002/jmri.27008
[15] Ding Z, Wu H, Song D, et al. Development and validation of a nomogram for predicting prostate cancer in men with prostate-specific antigen grey zone based on retrospective analysis of clinical and multi-parameter magnetic resonance imaging/transrectal ultrasound fusion-derived data[J]. Transl Androl Urol, 2020, 9(5), 2179-2191. doi: 10.21037/tau-20-1154
[16] 梁震, 朱军, 康家旗, 等. 双参数磁共振PI-RADS联合PSA相关指标在首次前列腺穿刺活检中的诊断价值[J]. 中华泌尿外科杂志, 2019, 40(10): 768-773. doi: 10.3760/cma.j.issn.1000-6702.2019.10.010
[17] Xi MW, Jie B, Mo Z, et al. Diagnostic value of prostate imaging reporting and data system version 1 and 2 in detection of prostate cancer in transition zone[J]. Chin J Radiol, 2017, 51(6): 427-431.
[18] Mertan FV, Greer MD, Shih JH, et al. Prospective Evaluation of the Prostate Imaging Reporting and Data System Version 2 for Prostate Cancer Detection[J]. J Urol, 2016, 196(3): 690-696. doi: 10.1016/j.juro.2016.04.057
[19] Chen Y, Ruan M, Zhou B, et al. Cutoff Values of Prostate Imaging Reporting and Data System Version 2.1 Score in Men With Prostate-specific Antigen Level 4 to 10 ng/mL: Importance of Lesion Location[J]. Clin Genitourin Cancer, 2021, 19(4), 288-295. doi: 10.1016/j.clgc.2020.12.007
-
图(3)
表(3)
计量
- 文章访问数: 1893
- PDF下载数: 156
- 施引文献: 0