
Value of PI-RADS v2.1 combined with PSAMR in the diagnosis of prostate cancer with tPSA < 20 ng/mL
-
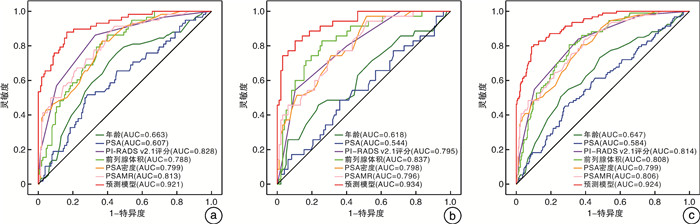
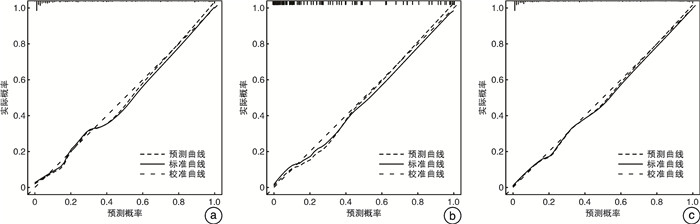
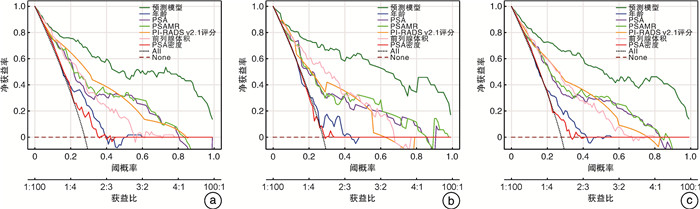
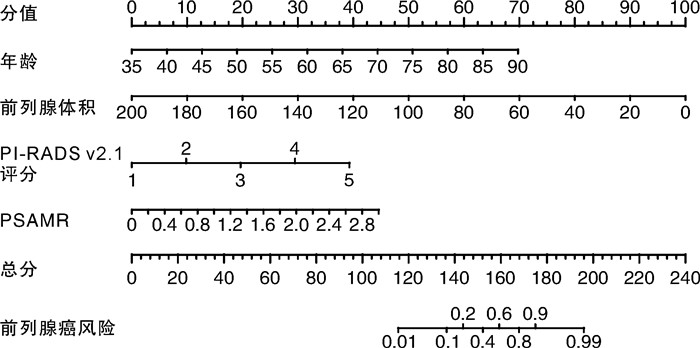
摘要: 目的 探索前列腺特异性抗原质量比(prostate specific antigen mass ratio,PSAMR)在总前列腺特异性抗原(total prostate-specific antigen,tPSA) < 20 ng/mL的前列腺癌(prostate cancer,PCa)诊断中的价值。并结合2.1版前列腺影像报告与数据系统(prostate imaging reporting and data system,PI-RADS v2.1)评分进一步建立预测PCa风险的预测模型。方法 回顾性分析2021年7月—2023年3月期间皖南医学院弋矶山医院收治的382例行MRITRUS融合靶向活检的可疑PCa患者的临床资料。入组患者的tPSA均在4~20 ng/mL之间,且穿刺前均行多参数磁共振(multi-parameter magnetic resonance imaging,mpMRI)检查,并按照PI-RADSv2.1进行评分。其中2021年7月—2022年9月的患者为开发队列,2022年10月—2023年3月的患者为验证队列。分别比较2队列PCa组和非PCa组间年龄、tPSA、游离/总前列腺特异性抗原(f/tPSA)、前列腺体积(prostate volume,PV)、PI-RADSv2.1评分、PSAMR的差异。采用单因素和多因素logistic回归分析探究PSAMR及其他指标与PCa发生的关系,其中多因素分析采用向后逐步回归法。根据多因素分析结果建立预测模型,分别在2队列及整体患者中以受试者工作特征(receiver operating characteristic,ROC)曲线、校准曲线及决策曲线分析(decision curve analysis,DCA)评估模型预测性能。结果 本研究共纳入342例患者,其中病理结果显示为前列腺腺癌的患者93例,非PCa的患者249例。开发队列患者共210例,PCa患者58例,非PCa患者152例。验证队列患者132例,PCa患者35例,非PCa患者97例。基于开发队列单因素和多因素分析显示,PSAMR(OR=5.467,P=0.020)是PCa发生的危险因素。纳入构建预测模型的因素包括年龄、前列腺体积、PI-RADSv2.1评分和PSAMR。预测模型在开发队列、验证队列和总体患者的ROC曲线下面积分别为0.921、0.934和0.924,诊断效能良好。校准曲线显示预测准确性良好。DCA曲线显示该预测模型具有临床应用价值。结论 在tPSA 4~20 ng/mL时,PSAMR是PCa的危险因素。纳入PI-RADS v2.1评分和PSAMR构建的预测模型可为前列腺穿刺活检决策提供参考。
-
关键词:
- 前列腺特异性抗原质量比 /
- 总前列腺特异抗原 /
- 前列腺癌 /
- 预测模型
Abstract: Objective To explore the value of prostate specific antigen mass ratio(PSAMR) in the diagnosis of prostate cancer(PCa) with total prostate-specific antigen(tPSA) < 20 ng/mL. The prediction model of PCa risk was further established.Methods The clinical data of 382 patients with suspected PCa who underwent MRITRUS fusion targeted biopsy admitted to Yijishan Hospital of Wannan Medical College from July 2021 to March 2023 were retrospectively analyzed. The tPSA of the enrolled patients was between 4 and 20 ng/mL. Multi-parameter magnetic resonance imaging(mpMRI) was performed before puncture, and the score was performed according to prostate imaging reporting and data system v2.1(PI-RADS v2.1). Among these, patients from July 2021 to September 2022 were the development cohort and patients from October 2022 to March 2023 were the validation cohort. Age, tPSA, f/tPSA, prostate volume (PV), and PI-RADS v2.1 were compared between the two cohorts of PCa and non-PCa groups, respectively. Univariate and multivariate logistic regression analysis were used to explore the relationship between PSAMR, other indicators and prostate cancer development, using stepwise backward regression. Based on the results of multivariate analysis, the prediction performance was evaluated by the receiver operating characteristic (ROC) curve, calibration curve, and decision curve analysis (DCA).Results A total of 342 patients were included in this study, including 93 patients with pathological findings of prostate adenocarcinoma and 249 patients with non-PCa. There were 210 patients in the development cohort, 58 with PCa and 152 without PCa. The validation cohort included 132 patients, 35 with PCa and 97 without PCa. Based on the univariate and multivariate analysis of the development cohort, PSAMR(OR=5.467, P=0.020) was a risk factor for the development of PCa. Factors included in constructing the prediction models included age, PV, PI-RADS v2.1 score, and PSAMR. The predictive model had the area under the ROC curve for the development cohort, validation cohort and overall patients 0.921, 0.934, and 0.924, respectively, with good diagnostic efficacy. The calibration curve showed a good predictive accuracy. DCA curve showed that the prediction model had clinical application value.Conclusion PSAMR is a risk factor for PCa at tPSA 4 to 20 ng/mL. The prediction model built with PSAMR and PI-RADS v2.1 can provide reference for prostate biopsy decision-making. -

-
表 1 开发队列患者的一般临床资料
X±S,M(P25,P75) 临床指标 开发队列 P值 总体(210例) 非PCa组(152例) PCa组(58例) 年龄/岁 68.32±9.02 67.01±9.04 71.76±8.10 0.001 PSA/(ng/mL) 10.50(7.38,13.95) 9.83(7.19,13.10) 12.93(8.56,14.82) 0.016 PI-RADS v2.1评分/分 2.00(2.00,3.00) 2.00(1.00,3.00) 4.00(3.00,4.00) < 0.001 前列腺体积/mL 51.18(37.07,69.31) 59.62(43.49,78.83) 36.97(28.90,47.77) < 0.001 f/t PSA 0.16(0.11,0.22) 0.17(0.12,0.23) 0.15(0.11,0.19) 0.063 PSAMR/(μg/mL) 0.56(0.39,0.81) 0.49(0.34,0.68) 0.86(0.61,1.34) < 0.001  下载: 导出CSV
表 2 验证队列患者的一般临床资料
M(P25,P75) 临床指标 验证队列 P值 总体(132例) 非PCa组(97例) PCa组(35例) 年龄/岁 67.99±8.77 67.07±8.52 70.54±9.05 0.044 PSA/(ng/mL) 9.98(7.11,13.43) 9.39(7.03,13.37) 10.30(7.64,13.58) 0.439 PI-RADS v2.1评分/分 3.00(2.00,3.00) 2.00(1.00,3.00) 4.00(3.00,4.00) < 0.001 前列腺体积/mL 52.89(37.97,71.88) 58.53(47.36,74.63) 32.26(25.68,45.03) < 0.001 f/t PSA 0.15(0.11,0.22) 0.16(0.11,0.22) 0.13(0.09,0.18) 0.021 PSAMR/(μg/mL) 0.52(0.37,0.75) 0.45(0.33,0.67) 0.79(0.59,1.27) < 0.001
下载: 导出CSV
表 3 2队列各临床指标的单因素分析
临床指标 开发队列 验证队列 β OR 95%CI P值 β OR 95%CI P值 年龄 0.066 1.068 1.027~1.110 0.001 0.048 1.049 1.001~1.100 0.047 PSA 0.09 1.094 1.016~1.178 0.017 0.039 1.040 0.950~1.138 0.400 前列腺体积 -0.061 0.941 0.921~0.962 < 0.001 -0.075 0.927 0.899~0.957 < 0.001 f/t PSA -4.116 0.016 0.000~1.008 0.050 -6.012 0.002 0.000~0.569 0.031 PI-RADS v2.1评分 1.275 3.578 2.457~5.210 < 0.001 1.082 2.951 1.892~4.604 < 0.001 PSAMR 2.867 17.591 6.381~48.495 < 0.001 3.327 27.863 6.775~114.587 < 0.001
下载: 导出CSV
表 4 2队列各临床指标的多因素分析
临床指标 开发队列 验证队列 β OR 95%CI P值 β OR 95%CI P值 年龄 0.145 1.156 1.084~1.233 < 0.001 0.159 1.172 1.070~1.284 0.001 前列腺体积 -0.057 0.944 0.916~0.947 < 0.001 -0.083 0.920 0.877~0.966 0.001 PI-RADS v2.1评分 1.123 3.074 1.934~4.888 < 0.001 1.115 3.048 1.674~5.552 < 0.001 PSAMR 1.699 5.467 1.304~22.912 0.020 3.201 24.546 1.675~359.613 0.019 常量 -12.568 < 0.001 < 0.001 -13.287 < 0.001 0.001
下载: 导出CSV
表 5 基于开发队列阈值概率下风险预测模型的各预测指标
队列 AUC 阈值 灵敏度 特异度 阳性预测值 阴性预测值 开发队列 0.921 0.24 0.879 0.835 0.671 0.948 验证队列 0.934 0.24 0.886 0.814 0.633 0.952
下载: 导出CSV
-
[1] Sung H, Ferlay J, Siegel RL, et al. Global cancer statistics 2020: GLOBOCAN estimates of incidence and mortality worldwide for 36 cancers in 185 countries[J]. CA Cancer J Clin, 2021, 71(3): 209-249. doi: 10.3322/caac.21660
[2] 叶定伟, 朱耀. 中国前列腺癌的流行病学概述和启示[J]. 中华外科杂志, 2015, 53(4): 249-252. doi: 10.3760/cma.j.issn.0529-5815.2015.04.003
[3] Perdana NR, Mochtar CA, Umbas R, et al. The risk factors of prostate cancer and its prevention: a literature review[J]. Acta Med Indones, 2016, 48(3): 228-238.
[4] Salem HA, Caddeo G, McFarlane J, et al. A multicentre integration of a computer-led follow-up of prostate cancer is valid and safe[J]. BJU Int, 2018, 122(3): 418-426. doi: 10.1111/bju.14157
[5] Siegel RL, Miller KD, Fedewa SA, et al. Colorectal cancer statistics, 2017[J]. CA Cancer J Clin, 2017, 67(3): 177-193. doi: 10.3322/caac.21395
[6] Bañez LL, Hamilton RJ, Partin AW, et al. Obesity-related plasma hemodilution and PSA concentration among men with prostate cancer[J]. JAMA, 2007, 298(19): 2275-2280. doi: 10.1001/jama.298.19.2275
[7] Choi HC, Park JH, Cho BL, et al. Prostate specific antigen mass ratio potential as a prostate cancer screening tool[J]. J Urol, 2010, 184(2): 488-493. doi: 10.1016/j.juro.2010.03.138
[8] 吉春冬, 刘凯, 冯越, 等. PSAMR联合PI-RADS v2评分对高级别前列腺癌的预测价值[J]. 国际肿瘤学杂志, 2020, 47(12): 723-727. doi: 10.3760/cma.j.cn371439-20200716-00108
[9] Draisma G, Etzioni R, Tsodikov A, et al. Lead time and overdiagnosis in prostate-specific antigen screening: importance of methods and context[J]. J Natl Cancer Inst, 2009, 101(6): 374-383. doi: 10.1093/jnci/djp001
[10] Hong SK, Oh JJ, Byun SS, et al. Value of prostate-specific antigen(PSA)mass ratio in the detection of prostate cancer in men with PSA levels of ≤10 ng/mL[J]. BJU Int, 2012, 110(2 Pt 2): E81-E85.
[11] Lee WK, Lee S, Hong SK, et al. Clinical utility of prostate-specific antigen mass ratio for prediction of prostate cancer detection on a repeated prostate biopsy[J]. Int Braz J Urol, 2014, 40(4): 484-492. doi: 10.1590/S1677-5538.IBJU.2014.04.06
[12] 李方龙, 李德维, 殷小涛, 等. 前列腺特异性抗原新参数在前列腺癌诊断中的应用[J]. 现代泌尿外科杂志, 2015, 20(12): 871-874. doi: 10.3969/j.issn.1009-8291.2015.12.010
[13] 王淼, 王萱, 侯惠民, 等. mp-MRI对前列腺癌诊断的敏感性及影响因素——基于前列腺癌病理大切片的单中心临床研究[J]. 中华泌尿外科杂志, 2020, 41(10): 746-751. doi: 10.3760/cma.j.cn112330-20200321-00216
[14] 罗进阳, 郑嘉欣, 蔡宗龙, 等. 基于第二版PI-RADS建立的预测模型对前列腺穿刺活检结果的预测价值[J]. 中华泌尿外科杂志, 2019, 40(9): 673-679. doi: 10.3760/cma.j.issn.1000-6702.2019.09.007
-
图(4)
表(5)
计量
- 文章访问数: 1198
- PDF下载数: 524
- 施引文献: 0