
Comparison of metabolic markers in prostate cancer patients before and after androgen deprivation therapy
-
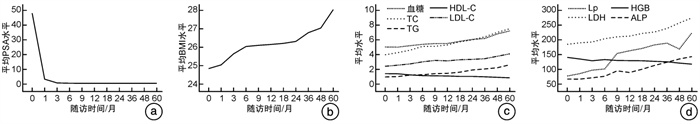
摘要: 目的 探讨雄激素剥夺治疗(androgen deprivation therapy,ADT)前列腺癌中代谢水平的差异对照研究。 方法 回顾性分析新疆维吾尔自治区人民医院泌尿中心和新疆医科大学第七附属医院泌尿外科2010年1月—2020年12月收治的342例前列腺癌患者的临床资料。均行ADT治疗,并且对前列腺癌患者治疗前及治疗后5年内的前列腺特异性抗原(PSA)、血糖、血脂[总胆固醇(TC)、甘油三酯(TG)、高密度脂蛋白(HDL-C)、低密度脂蛋白(LDL-C)、游离脂肪酸(Lp)]、乳酸脱氢酶(LDH)、碱性磷酸酶(ALP)、血红蛋白(HGB)、体重指数(BMI)变化水平进行对照研究。 结果 本研究纳入了342例前列腺癌患者都完成随访5年,治疗前中位PSA水平为47.72(17.93,100.00) ng/mL,治疗后1个月开始PSA水平有下降趋势,与治疗前比较差异有统计学意义(P<0.05);治疗后1个月内血糖、ALP水平无明显变化,从第3个月开始有增高趋势,与治疗前比较差异有统计学意义(P<0.05);TC、TG、LDL-C、Lp、LDH、BMI水平从第1个月开始有增高趋势,与治疗前比较差异有统计学意义(P<0.05);HDL-C、HGB水平从第1个月开始有下降趋势,与治疗前比较差异有统计学意义(P<0.05)。 结论 虽然ADT的使用有效降低了前列腺癌患者的PSA水平,但由此产生的性腺功能减退可引起血糖、ALP、LDH、BMI水平升高、血脂异常、HGB水平降低等代谢异常。Abstract: Objective To investigate the difference of metabolic levels in androgen deprivation therapy (ADT) for the treatment of prostate cancer. Methods The clinical data of 342 patients with prostate cancer admitted to Urology Center of People's Hospital of Xinjiang Uygur Autonomous Region and Department of Urology of Seventh Affiliated Hospital of Xinjiang Medical University from January 2010 to December 2020 were retrospectively analyzed. ADT was performed in all patients with prostate cancer, and the changes of PSA, blood glucose, blood lipids (TC, TG, HDL-C, LDL-C, Lp), LDH, ALP, HGB and BMI were studied before and 5 years after treatment. Results The median PSA level before treatment was 47.72 ng/mL (range: 17.93-100.00 ng/mL), and it began to decrease 1 month after the treatment. Blood glucose and ALP levels did not change significantly within 1 month of treatment, but there was an increase starting at 3 months, showing statistically significant difference from the level before treatment (P < 0.05). TC, TG, LDL-C, Lp, LDH, and BMI increased starting at 1 month. HDL-C and HGB began decreasing at 1 month. The differences in the values for all these metabolic markers before and after treatment were statistically significant (P < 0.05). Conclusion Although ADT effectively reduced PSA level in patients with prostate cancer, the resulting hypogonadism can cause metabolic abnormalities, such as elevated blood glucose, ALP, LDH, and BMI levels, dyslipidemia, and decreased HGB level. These levels should be monitored to ensure appropriate early intervention.
-
Key words:
- prostate cancer /
- androgen deprivation therapy /
- metabolic disturbance
-

-
表 1 各项指标5年内变化趋势
指标 治疗前 治疗后 1个月 3个月 6个月 9个月 12个月 18个月 24个月 36个月 48个月 60个月 PSA/(ng/mL) 47.72 2.86 0.30 0.09 0.06 0.04 0.03 0.01 0.01 0.00 0.00 血糖/(mmol/L) 4.92 4.90 5.10 5.29 5.39 5.40 5.69 5.95 6.08 6.70 7.10 血脂 TC/(mmol/L) 3.86 4.15 4.49 5.00 5.02 5.20 5.62 5.90 6.30 6.90 7.40 TG/(mmol/L) 0.85 0.90 1.10 1.15 1.30 1.34 1.50 1.80 1.94 2.10 2.50 HDL-C/(mmol/L) 1.30 1.28 1.13 1.03 1.00 0.98 0.92 0.92 0.87 0.80 0.73 LDL-C/(mmol/L) 2.30 2.45 2.62 2.90 3.10 3.04 3.19 3.24 3.33 3.66 3.99 LP/(mg/L) 76.00 84.00 96.00 100.00 152.90 162.00 170.00 182.00 188.00 168.00 223.00 LDH/(U/L) 184.02 189.00 192.00 203.00 209.47 212.00 221.00 226.00 238.00 257.00 274.00 HGB/(G/L) 139.50 134.00 128.00 132.00 129.00 128.50 128.00 126.00 124.50 120.00 116.50 ALP/(U/L) 65.67 65.50 70.00 75.00 93.50 88.00 99.00 112.00 123.00 134.00 142.12 BMI/(kg/m2) 24.80 25.00 25.60 26.00 26.06 26.11 26.17 26.28 26.75 27.00 28.00  下载: 导出CSV
表 2 血清PSA治疗前后变化水平
例(%) PSA 治疗前 治疗后 1个月 3个月 6个月 9个月 12个月 18个月 24个月 36个月 48个月 60个月 正常 16(4.7) 199(58.2) 271(79.2) 283(82.7) 291(85.1) 292(85.4) 304(88.9) 313(91.5) 313(91.5) 317(92.7) 313(91.5) 异常 326(95.3) 143(41.8) 71(20.8) 59(17.3) 51(14.9) 50(14.6) 38(11.1) 29(8.5) 29(8.5) 25(7.3) 29(8.5) 注:PSA正常值范围为0~4 ng/mL。
下载: 导出CSV
表 3 血糖、血脂治疗前后变化水平
例(%) 指标 治疗前 治疗后 1个月 3个月 6个月 9个月 12个月 18个月 24个月 36个月 48个月 60个月 血糖 偏低 30(8.8) 25(7.3) 9(2.6) 5(1.5) 3(0.9) 3(0.9) 1(0.3) 5(1.5) 3(0.9) 2(0.6) 0(0) 正常 258(75.4) 248(72.5) 247(72.2) 243(71.1) 236(69.0) 238(69.6) 216(63.2) 187(54.7) 181(52.9) 134(39.2) 98(28.7) 偏高 54(15.8) 69(20.2) 86(25.1) 94(27.5) 103(30.1) 101(29.5) 125(36.5) 150(43.9) 158(46.2) 206(60.2) 244(71.3) 血脂 TC 偏低 14(4.1) 2(0.6) 2(0.6) 2(0.6) 2(0.6) 1(0.3) 2(0.6) 0(0) 0(0) 1(0.3) 1(0.3) 正常 327(95.6) 323(94.4) 339(99.1) 338(98.8) 338(98.8) 319(93.3) 316(92.4) 239(69.9) 184(53.8) 145(42.4) 125(36.5) 偏高 1(0.3) 17(5.0) 1(0.3) 2(0.6) 2(0.6) 22(6.4) 24(7.0) 103(30.1) 158(46.2) 196(57.3) 216(63.2) TG 正常 318(93.0) 294(86.0) 288(84.2) 280(81.9) 233(68.1) 251(73.4) 228(66.7) 166(48.5) 141(41.2) 130(38.0) 63(18.4) 偏高 24(7.0) 48(14.0) 54(15.8) 62(18.1) 109(31.9) 91(26.6) 114(33.3) 176(51.5) 201(58.8) 212(62.0) 279(81.6) HDL-C 正常 141(41.2) 100(29.2) 90(26.3) 78(22.8) 72(21.1) 66(19.3) 49(14.3) 24(7.0) 22(6.4) 2(0.6) 3(0.9) 偏低 201(58.8) 242(70.8) 252(73.7) 264(77.2) 270(78.9) 276(80.7) 293(85.7) 318(93.0) 320(93.6) 340(99.4) 339(99.1) LDL-C 正常 329(96.2) 309(90.4) 304(88.9) 288(84.2) 283(82.7) 260(76.0) 208(60.8) 199(58.2) 192(56.1) 122(35.7) 27(7.9) 偏高 13(3.8) 33(9.6) 38(11.1) 54(15.8) 59(17.3) 82(24.0) 134(39.2) 143(41.8) 150(43.9) 220(64.3) 315(92.1) Lp 正常 338(98.8) 333(97.4) 331(96.8) 302(88.3) 302(88.3) 295(86.3) 294(86.0) 265(77.5) 235(68.7) 229(67.0) 221(64.6) 偏高 4(1.2) 9(2.6) 11(3.2) 40(11.7) 40(11.7) 47(13.7) 48(14.0) 77(22.5) 107(31.3) 113(33.0) 121(35.4) 注:血糖正常值范围为3.9~6.1 mmol/L;TC正常值范围为2.59~6.47 mmol/L;TG正常值范围为0~1.7 mmol/L;HDL-C正常值范围为>1.04 mmol/L;LDL-C正常值范围为0~3.37 mmol/L;Lp正常值范围为0~300 mg/L。
下载: 导出CSV
表 4 血清LDH、HGB、ALP治疗前后变化水平
例(%) 指标 治疗前 治疗后 1个月 3个月 6个月 9个月 12个月 18个月 24个月 36个月 48个月 60个月 LDH 偏低 13(3.8) 9(2.6) 7(2.0) 4(1.2) 3(0.9) 0(0) 1(0.3) 0(0) 1(0.3) 0(0) 0(0) 正常 286(83.6) 296(86.5) 293(85.7) 299(87.4) 242(70.8) 246(71.9) 233(68.1) 219(64.0) 185(54.1) 164(48.0) 106(31.0) 偏高 43(12.6) 37(10.8) 42(12.3) 39(11.4) 97(28.4) 96(28.1) 108(31.6) 123(36.0) 156(45.6) 178(52.0) 236(69.0) HGB 偏低 92(26.9) 131(38.3) 176(51.5) 155(45.3) 173(50.6) 172(50.3) 189(55.3) 214(62.6) 220(64.3) 247(72.2) 270(78.9) 正常 246(71.9) 211(61.7) 166(48.5) 187(54.7) 169(49.4) 170(49.7) 153(44.7) 128(37.4) 122(35.7) 95(27.8) 71(20.8) 偏高 4(1.2) 0(0) 0(0) 0(0) 0(0) 0(0) 0(0) 0(0) 0(0) 0(0) 1(0.3) ALP 偏低 9(2.6) 8(2.3) 6(1.8) 7(2.0) 3(0.9) 3(0.9) 1(0.3) 1(0.3) 1(0.3) 3(0.9) 2(0.6) 正常 316(92.4) 308(90.1) 315(92.1) 284(83.0) 276(80.7) 261(76.3) 257(75.1) 204(59.6) 194(56.7) 158(46.2) 123(36.0) 偏高 17(5.0) 26(7.6) 21(6.1) 51(14.9) 63(18.4) 78(22.8) 84(24.6) 137(40.1) 147(43.0) 181(52.9) 217(63.5) 注:LDH正常值范围为120~150 U/L;HGB正常值范围为130~175 G/L;ALP正常值范围为45~125 U/L。
下载: 导出CSV
表 5 BMI治疗前后变化水平
例(%) BMI 治疗前 治疗后 1个月 3个月 6个月 9个月 12个月 18个月 24个月 36个月 48个月 60个月 偏瘦 19(5.6) 16(4.7) 13(3.8) 2(0.6) 13(3.8) 12(3.5) 2(0.6) 2(0.6) 13(3.8) 13(3.8) 0(0) 正常 89(26.0) 85(24.9) 64(18.7) 78(22.8) 54(15.8) 55(16.1) 60(17.5) 54(15.8) 35(10.2) 29(8.5) 34(9.9) 肥胖 234(68.4) 241(70.5) 265(77.5) 262(76.6) 275(80.4) 275(80.4) 280(81.9) 286(83.6) 294(86.0) 300(87.7) 308(90.1) 注:BMI正常值范围为18.5~23.9 kg/m。
下载: 导出CSV
-
[1] Melloni C, Roe MT. Androgen deprivation therapy and cardiovascular disease[J]. Urol Oncol, 2020, 38(2): 45-52. doi: 10.1016/j.urolonc.2019.02.010
[2] Collins L, Mohammed N, Ahmad T, et al. Androgen deprivation therapy for prostate cancer: implications for cardiometabolic clinical care[J]. J Endocrinol Invest, 2012, 35(3): 332-339.
[3] Leão R, Domingos C, Figueiredo A, et al. Cancer stem cells in prostate cancer: implications for targeted therapy[J]. Urol Int, 2017, 99(2): 125-136. doi: 10.1159/000455160
[4] Braga-Basaria M, Dobs AS, Muller DC, et al. Metabolic syndrome in men with prostate cancer undergoing long-term androgen-deprivation therapy[J]. J Clin Oncol, 2006, 24(24): 3979-3983. doi: 10.1200/JCO.2006.05.9741
[5] Harrington JM, Schwenke DC, Epstein DR, et al. Androgen-deprivation therapy and metabolic syndrome in men with prostate cancer[J]. Oncol Nurs Forum, 2014, 41(1): 21-29. doi: 10.1188/14.ONF.21-29
[6] Karzai FH, Madan RA, Dahut WL. Metabolic syndrome in prostate cancer: impact on risk and outcomes[J]. Future Oncol, 2016, 12(16): 1947-1955. doi: 10.2217/fon-2016-0061
[7] Yu IC, Lin HY, Sparks JD, et al. Androgen receptor roles in insulin resistance and obesity in males: the linkage of androgen-deprivation therapy to metabolic syndrome[J]. Diabetes, 2014, 63(10): 3180-3188. doi: 10.2337/db13-1505
[8] Dawson JK, Dorff TB, Todd Schroeder E, et al. Impact of resistance training on body composition and metabolic syndrome variables during androgen deprivation therapy for prostate cancer: a pilot randomized controlled trial[J]. BMC Cancer, 2018, 18(1): 368. doi: 10.1186/s12885-018-4306-9
[9] Gagliano-Jucá T, Burak MF, Pencina KM, et al. Metabolic changes in androgen-deprived nondiabetic men with prostate cancer are not mediated by cytokines or aP2[J]. J Clin Endocrinol Metab, 2018, 103(10): 3900-3908. doi: 10.1210/jc.2018-01068
[10] Kitajima K, Murphy RC, Nathan MA, et al. Detection of recurrent prostate cancer after radical prostatectomy: comparison of 11C-choline PET/CT with pelvic multiparametric MR imaging with endorectal coil[J]. J Nucl Med, 2014, 55(2): 223-232. doi: 10.2967/jnumed.113.123018
[11] Pasoglou V, Michoux N, Peeters F, et al. Whole-body 3D T1-weighted MR imaging in patients with prostate cancer: feasibility and evaluation in screening for metastatic disease[J]. Radiology, 2015, 275(1): 155-166. doi: 10.1148/radiol.14141242
[12] Beebe-Dimmer J, Morgenstern H, Cetin K, et al. Androgen deprivation therapy and cataract incidence among elderly prostate cancer patients in the United States[J]. Ann Epidemiol, 2011, 21(3): 156-163. doi: 10.1016/j.annepidem.2010.10.003
[13] Di Sebastiano KM, Pinthus JH, Duivenvoorden WCM, et al. Glucose impairments and insulin resistance in prostate cancer: the role of obesity, nutrition and exercise[J]. Obes Rev, 2018, 19(7): 1008-1016. doi: 10.1111/obr.12674
[14] Wei RJ, Li TY, Yang XC, et al. Serum levels of PSA, ALP, ICTP, and BSP in prostate cancer patients and the significance of ROC curve in the diagnosis of prostate cancer bone metastases[J]. Genet Mol Res, 2016, 15(2).
[15] Collier A, Ghosh S, McGlynn B, et al. Prostate cancer, androgen deprivation therapy, obesity, the metabolic syndrome, type 2 diabetes, and cardiovascular disease: a review[J]. Am J Clin Oncol, 2012, 35(5): 504-509. doi: 10.1097/COC.0b013e318201a406
[16] Smith MR, Finkelstein JS, McGovern FJ, et al. Changes in body composition during androgen deprivation therapy for prostate cancer[J]. J Clin Endocrinol Metab, 2002, 87(2): 599-603. doi: 10.1210/jcem.87.2.8299
[17] Smith MR, Lee H, McGovern F, et al. Metabolic changes during gonadatropin releasing hormone agonist therapy for prostate cancer[J]. Cancer, 2008, 112(10): 2188-2194. doi: 10.1002/cncr.23440
[18] Smith MR, Lee H, Nathan DM. Insulin sensitivity during combined androgen blockade for prostate cancer[J]. J Clin Endocrinol Metab, 2006, 91(4): 1305-1308. doi: 10.1210/jc.2005-2507
[19] Saigal CS, Gore JL, Krupski TL, et al. Androgen deprivation therapy increases cardiovascular morbidity in men with prostate cancer[J]. Cancer, 2007, 110(7): 1493-1500. doi: 10.1002/cncr.22933
[20] Lv W, Shang HX, Pei XQ, et al. A simple prognostic model involving prostate-specific antigen, alkaline phosphatase and albumin for predicting the time required to progress to castration-resistant prostate cancer in patients who received androgen deprivation therapy[J]. Int Urol Nephrol, 2017, 49(1): 61-67. doi: 10.1007/s11255-016-1456-z
[21] Matsuyama H, Shimabukuro T, Hara I, et al. Combination of hemoglobin, alkaline phosphatase, and age predicts optimal docetaxel regimen for patients with castration-resistant prostate cancer[J]. Int J Clin Oncol, 2014, 19(5): 946-954. doi: 10.1007/s10147-013-0638-2
[22] Bandara V, Capp A, Ahmed G, et al. Assessment and predictors of fatigue in men with prostate cancer receiving radiotherapy and androgen deprivation therapy[J]. J Med Imaging Radiat Oncol, 2019, 63(5): 683-690. doi: 10.1111/1754-9485.12922
[23] Pereira-Nunes A, Simões-Sousa S, Pinheiro C, et al. Targeting lactate production and efflux in prostate cancer[J]. Biochim Biophys Acta Mol Basis Dis, 2020, 1866(11): 165894. doi: 10.1016/j.bbadis.2020.165894
[24] 麦伍拉尼·马木提, 阿孜古力·克热木, 艾克拜尔·吾曼尔, 等. 不同LHRH激动剂治疗转移性激素敏感性前列腺癌中PSA和睾酮水平的差异对照研究[J]. 临床泌尿外科杂志, 2021, 36(12): 974-979. https://lcmw.whuhzzs.com/article/doi/10.13201/j.issn.1001-1420.2021.12.012
-
图(1)
表(5)
计量
- 文章访问数: 1069
- PDF下载数: 493
- 施引文献: 0